建立一个逻辑回归模型,根据已有的录取学生的考试成绩数据,预测一个学生是否能被录取.查看源码
准备工作 数据说明 每一列代表的意义分别是 IQ,EQ, 是否录取
1
2
3
4
5
6
7
8
34.62365962451697,78.0246928153624,0 30.28671076822607,43.89499752400101,0 35.84740876993872,72.90219802708364,0 60.18259938620976,86.30855209546826,1 79.0327360507101,75.3443764369103,1 45.08327747668339,56.3163717815305,0 61.10666453684766,96.51142588489624,1 ...
python 库准备 1 2 3 4 5 6 7 8 9 10 11 12 13 import numpy as np import pandas as pd import matplotlib as mpl import matplotlib.pyplot as plt import os import time # matplotlib 中文 mpl.rcParams[u'font.sans-serif'] = ['SimHei'] mpl.rcParams['axes.unicode_minus'] = False # pandas 加载数据 data_path = os.path.dirname(os.path.realpath(__file__)) + '/data/LogiReg_data.txt'
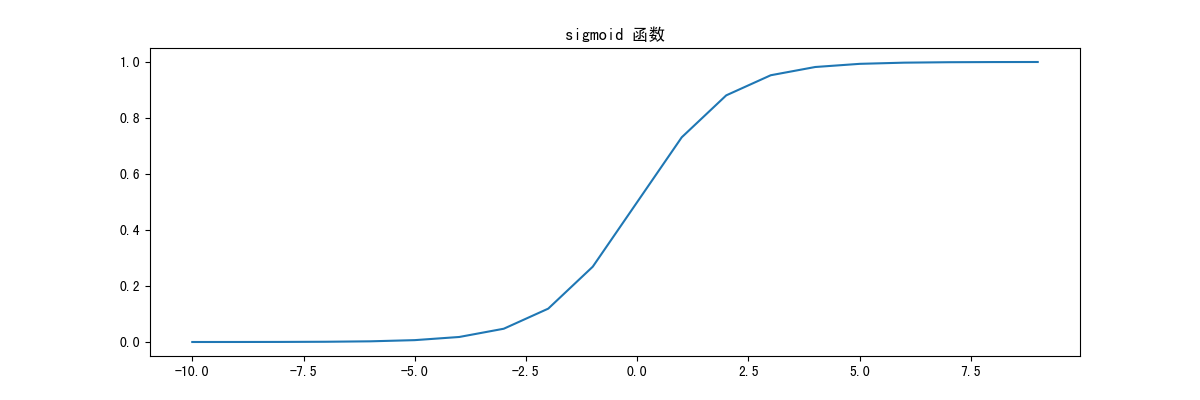
Sigmoid 函数 sigmoid函数连续,光滑,严格单调,以(0,0.5)中心对称,它可以把任何一个值转换为一个0到1之间的数,是一个非常良好的阈值函数。
公式 $$
python 实现 1 2 3 4 5 6 7 8 9 10 11 12 13 14 15 16 17 def sigmoid(z): """ 映射到概率的函数, 可以把一个值映射到从0到1的一个值 :param z: :return: """ return 1 / (1 + np.exp(-z)) def show_sigmoid_demo(): nums = np.arange(-10, 10) fig, ax = plt.subplots(figsize=(12, 4)) ax.plot(nums, sigmoid(nums)) ax.set_title("sigmoid 函数") plt.show() if __name__ == '__main__': show_sigmoid_demo()
逻辑回归模型 回归模型是为一组样本找到一组最优参数,以此得出最拟合实际的模型.
$$
python 实现 1 2 3 4 5 6 7 8 def model(X, theta): """ 返回预测结果值 :param X: 样本 :param theta: 参数 :return: """ return sigmoid(np.dot(X, theta.T))
损失函数 损失函数是用来度量拟合的程度的, 损失函数越小,就代表模型拟合的越好。损失函数的期望成为平均损失(经验风险),
python 实现 1 2 3 4 5 6 7 8 9 10 11 def cost(X, y, theta): """ 损失函数(代价函数) 根据参数计算损失,损失越小,拟合越好 :param X: 样本 :param y: 目标值 :param theta: 参数 :return: """ left = np.multiply(-y, np.log(model(X, theta))) right = np.multiply(1 - y, np.log(1 - model(X, theta))) return np.sum(left - right) / (len(X))
计算梯度 $$
python 实现 1 2 3 4 5 6 7 8 9 10 11 12 13 14 15 def gradient(X, y, theta): """ 计算每个参数的梯度方向 :param X: 样本 :param y: 目标值 :param theta: 参数 :return: """ grad = np.zeros(theta.shape) error = (model(X, theta) - y).ravel() # 计算误差 for j in range(len(theta.ravel())): term = np.multiply(error, X[:, j]) grad[0, j] = np.sum(term) / len(X) # 计算每项的梯度 return grad
梯度下降求解 三种不同的停止迭代策略 1 2 3 4 5 6 7 8 9 10 11 12 13 14 15 16 17 18 STOP_ITER = 0 # 根据迭代次数停止迭代 STOP_COST = 1 # 根据损失值的变化停止迭代,如果两次迭代损失值变化很小很小,就停止迭代 STOP_GRAD = 2 # 根据梯度,如果梯度变化很小很小,就停止迭代 def stopCriterion(type, value, threshold): """ 设定三种不同的停止策略 :param type: :param value: :param threshold: :return: """ if type == STOP_ITER: return value > threshold elif type == STOP_COST: return abs(value[-1]-value[-2]) < threshold elif type == STOP_GRAD: return np.linalg.norm(value) < threshold
打乱数据 1 2 3 4 5 6 7 8 9 10 11 def shuffleData(data): """ 重组数据 :param data: :return: """ np.random.shuffle(data) cols = data.shape[1] X = data[:, 0:cols-1] y = data[:, cols-1:] return X, y
求梯度下降 1 2 3 4 5 6 7 8 9 10 11 12 13 14 15 16 17 18 19 20 21 22 23 24 25 26 27 28 29 30 31 32 33 34 35 36 37 38 39 40 def descent(data, theta, batchSize, stopType, thresh, alpha, n): """ 梯度下降求解,计算参数更新 :param data: 样本数据 :param theta: 参数 :param batchSize: 每次迭代计算的样本数量 :param stopType: 停止策略 :param thresh: 停止策略对应的阈值 :param alpha: 学习率 :param n: 样本总数量 :return: """ init_time = time.time() # 初始化 i = 0 # 迭代次数 k = 0 # 每次迭代计算的样本数量 X, y = shuffleData(data) grad = np.zeros(theta.shape) # 计算的梯度 costs = [cost(X, y, theta)] # 损失值 while True: grad = gradient(X[k:k + batchSize], y[k:k + batchSize], theta) k += batchSize # 取batch数量个数据 if k >= n: k = 0 X, y = shuffleData(data) # 重新洗牌 theta = theta - alpha * grad # 参数更新 costs.append(cost(X, y, theta)) # 计算新的损失 i += 1 if stopType == STOP_ITER: value = i elif stopType == STOP_COST: value = costs elif stopType == STOP_GRAD: value = grad if stopCriterion(stopType, value, thresh): break return theta, i - 1, costs, grad, time.time() - init_time
预测 使用梯度下降计算出一组参数后,就可以使用这个模型对测试数据进行预测
1
2
3
4
5
6
7
8
def predict(X,theta): """ 返回预测值 :param X: 测试样本 :param theta: 梯度下降计算得到的参数 :return: """ return [1 if x > 0.5 else 0 for x in model(X, theta)]
运行 封装运行函数 1 2 3 4 5 6 7 8 9 10 11 12 13 14 15 16 17 18 19 20 21 22 23 24 25 26 27 28 29 30 31 32 33 34 35 36 37 38 39 40 41 42 43 44 45 46 47 def runExpe(data, theta, batchSize, stopType, thresh, alpha, n): """ :param data: 样本 :param theta: 参数 :param batchSize: 每次迭代要计算的样本数量,根据这个值,可以分为三种不同的梯度下降算法 batchSize == n(样本总量): 批量梯度下降,每次迭代计算所有样本,速度慢,精度高 batchSize == 1(样本总量): 随机梯度下降,每次迭代计算一个样本,速度快,精度低 batchSize == m(部分样本): 随机梯度下降,每次迭代计算一部分样本,兼顾速度和精度 :param stopType: 三种停止策略 STOP_ITER == 0: 根据迭代次数停止迭代 STOP_COST == 1: 根据损失值的变化停止迭代,如果两次迭代损失值变化很小很小,就停止迭代 STOP_GRAD == 2: 根据梯度,如果梯度变化很小很小,就停止迭代 :param thresh: 针对不同停止策略的阈值 :param alpha: 学习率 :param n: 样本重量 :return: """ theta, iter, costs, grad, dur = descent(data, theta, batchSize, stopType, thresh, alpha, n) title = "原始数据" if (data[:, 1] > 2).sum() > 1 else "标准化数据" if batchSize == n: strDescType = "批量梯度下降" elif batchSize == 1: strDescType = "随机梯度下降" else: strDescType = "小批量梯度下降 ({})".format(batchSize) title += strDescType + " 学习率: {} ".format(alpha) title += " 迭代停止策略: " if stopType == STOP_ITER: strStop = "迭代次数 = {}".format(thresh) elif stopType == STOP_COST: strStop = "损失变化 < {}".format(thresh) else: strStop = "梯度变化 < {}".format(thresh) title += strStop print("***{}\nTheta: {} - Iter: {} - Last cost: {:03.2f} - Duration: {:03.2f}s".format( title, theta, iter, costs[-1], dur)) fig, ax = plt.subplots(figsize=(12, 4)) ax.plot(np.arange(len(costs)), costs, 'r') ax.set_xlabel('迭代次数') ax.set_ylabel('损失') ax.set_title(title) plt.show() return theta
加载数据 1 2 3 4 5 6 7 8 9 10 11 12 13 14 if __name__ == '__main__': # 查看 sigmoid 函数曲线 show_sigmoid_demo() student_data = pd.read_csv(data_path, header=None, names=['iq', 'eq', 'admitted']) # show_plt(student_data) # 添加一列偏置项系数, 设置为1 student_data.insert(0, 'ones', 1) # 设置原始样本X和目标值y orig_data = student_data.as_matrix() # 把DataFrame转为矩阵,方便计算 cols = orig_data.shape[1] X = orig_data[:, 0:cols-1] y = orig_data[:, cols-1:] # 给参数设置一个初始值 theta = np.zeros([1, 3]
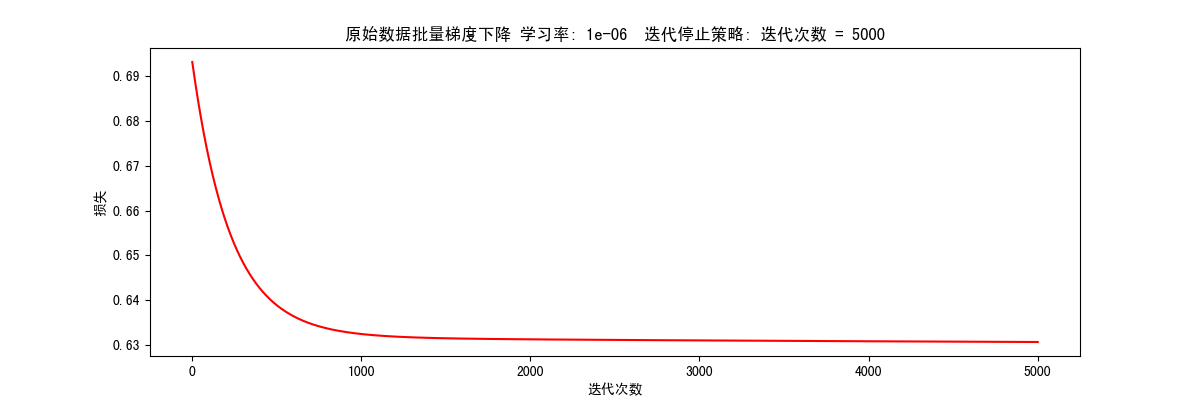
批量梯度下降 根据迭代次数停止(STOP_ITER) 1 2 # 根据迭代次数停止,设置阈值 5000, 迭代5000次 res = runExpe(orig_data, theta, 100, STOP_ITER, 5000, 0.000001, 100)
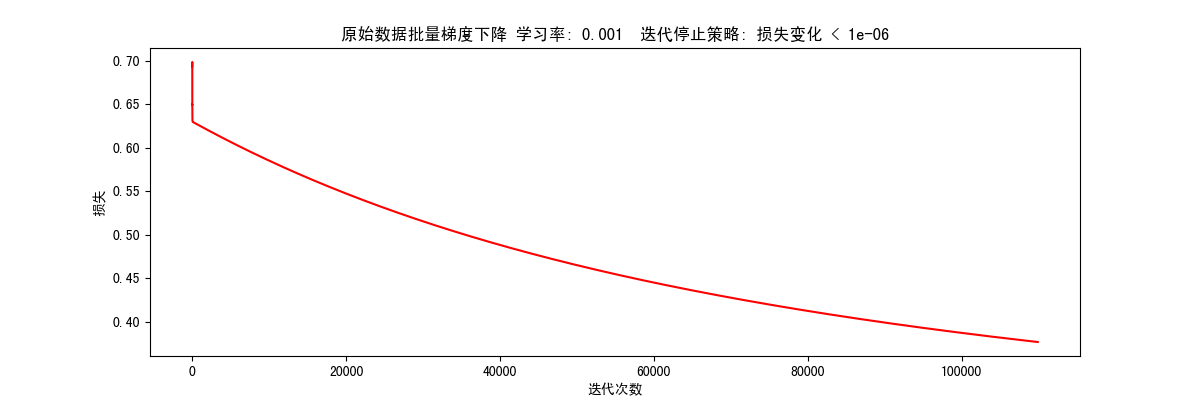
根据损失值变化停止(STOP_COST) 1 res = runExpe(orig_data, theta, 100, STOP_COST, 0.000001, 0.001, 100)
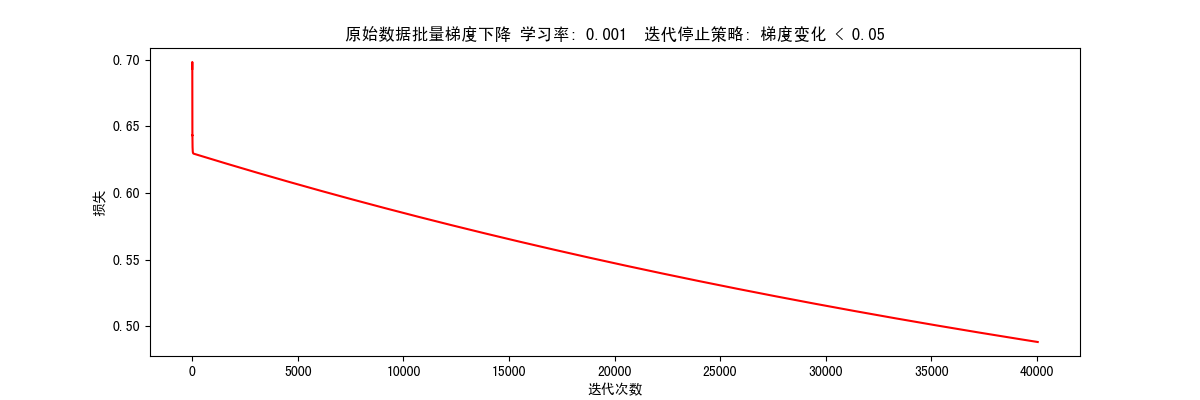
根据梯度变化停止(STOP_GRAD) 1 res = runExpe(orig_data, theta, 100, STOP_GRAD, 0.05, 0.001, 100)
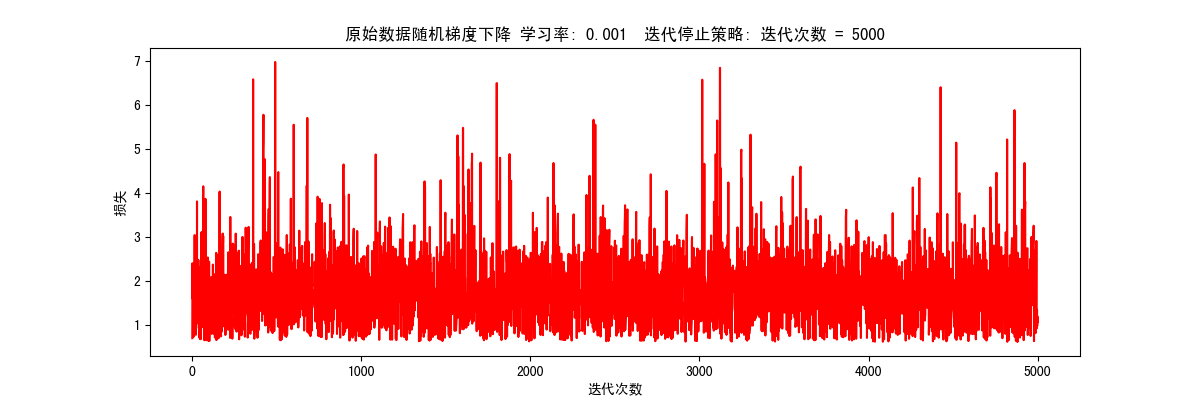
随机梯度下降 1 res = runExpe(orig_data, theta, 1, STOP_ITER, 5000, 0.001, 100)
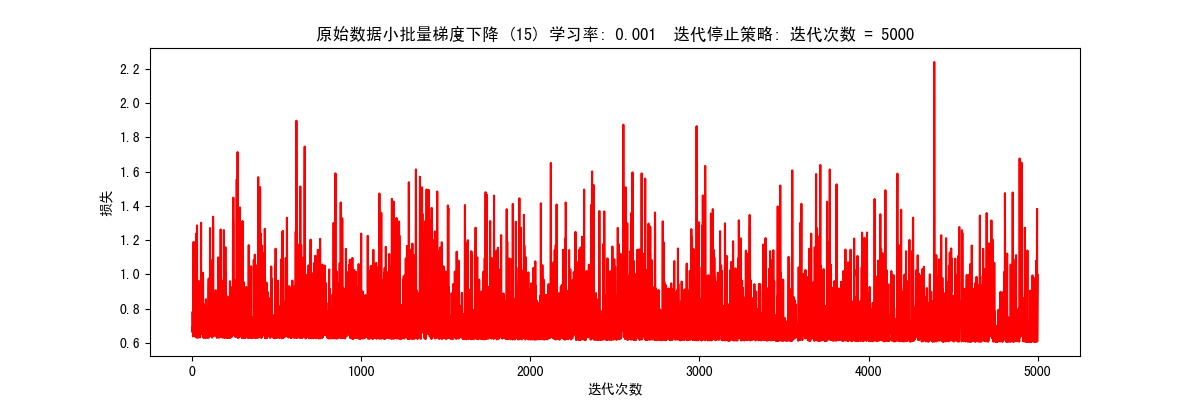
小批量梯度下降 根据迭代次数停止(STOP_ITER) 1 2 # 根据迭代次数停止,设置阈值 5000, 迭代5000次 res = runExpe(orig_data, theta, 15, STOP_ITER, 5000, 0.001, 100)
小批量梯度下降(标准化数据) 数据标准化(数据预处理) 将数据按其属性(按列进行)减去其均值,然后除以其方差。最后得到的结果是,对每个属性/每列来说所有数据都聚集在0附近,方差值为1.
1 2 3 from sklearn import preprocessing as pp scaled_data = orig_data.copy() scaled_data[:, 1:3] = pp.scale(orig_data[:, 1:3])
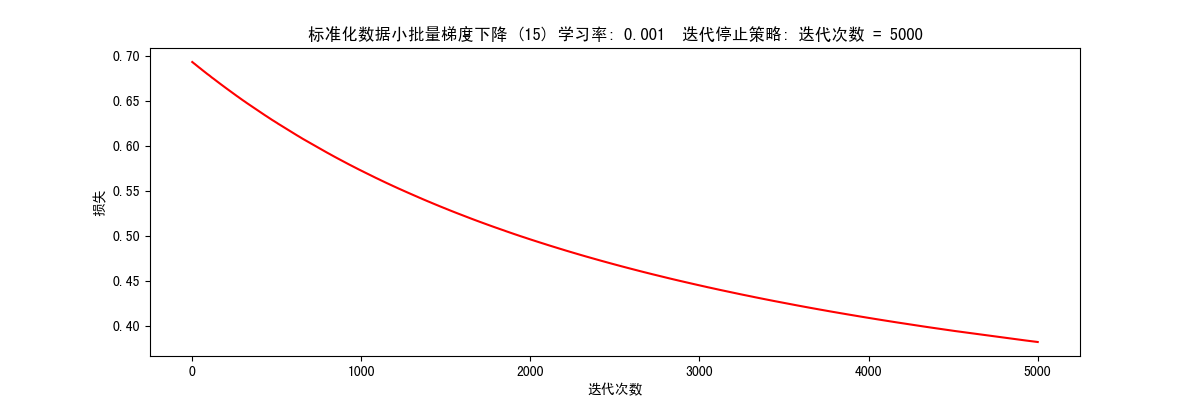
根据迭代次数停止(STOP_ITER) 1 res = runExpe(scaled_data, theta, 15, STOP_ITER, 5000, 0.001, 100)
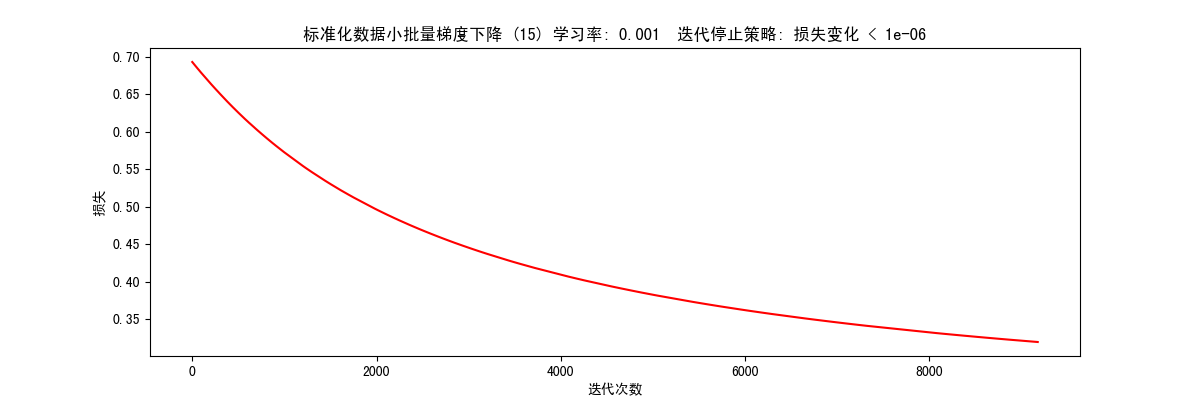
根据损失值变化停止(STOP_COST) 1 res = runExpe(scaled_data, theta, 15, STOP_COST, 0.000001, 0.001, 100)
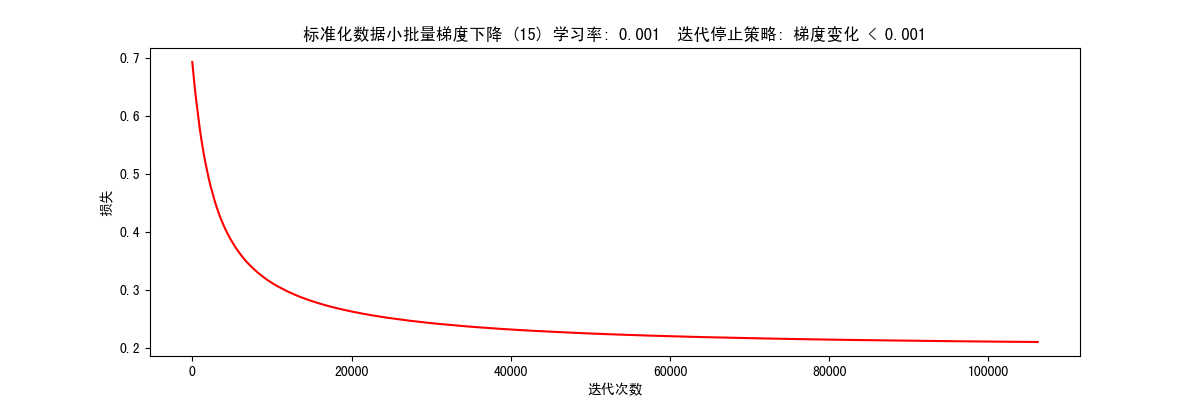
根据梯度变化停止(STOP_GRAD) 1 res = runExpe(scaled_data, theta, 15, STOP_GRAD, 0.001, 0.001, 100)
预测 1 2 3 4 5 6 7 8 9 # 要被预测的数据 scaled_X = scaled_data[:, :3] # 目标值 y = scaled_data[:, 3] # 传入梯度下降算法得出的参数 predictions = predict(scaled_X, res) correct = [1 if a == b else 0 for (a, b) in zip(predictions, y)] accuracy = (sum(map(int, correct)) % len(correct)) print('准确率 = {0}%'.format(accuracy)) # 准确率 = 89%
总结
使用样本训练模型前,应该先对样本进行预处理
使用小批量梯度下降算法兼顾速度和准确度,推荐使用这种方式训练模型
训练模型的过程中,需要不断的调整迭代停止策略和对应的阈值以及学习率,直到找到满足需求的参数
